Emil Broegger
August 11, 2025
•
5 min read
We have just released version 1.9 of Optomo which includes a novel way to debug by seeing exactly what your robots are doing on your VDIs as they work.
The problem with errors in RPA
When running RPA at scale, you know the reduction of errors is paramount to running a smooth operation with a low degree of manual intervention. Still, it is impossible to avoid errors completely – in fact, KPMG data from the RPA industry shows that the median percentage of unsuccessful cases amounts to 7% of all cases processed across operations. So, efficient debugging and troubleshooting of these errors are vital.
The nature of errors can be complex. Today, when you face an error, you’re often left asking: “what exactly happened on that machine?”. Logs do not always provide the full picture and screenshots provided by the existing debugging features in your RPA software can be insufficient. Taking a specific troublesome case step-by-step through the process to pinpoint the exact cause of the error is tedious and time-consuming. There are many things you would rather be doing, but those errors are not going to fix themselves!
What you need is a clearer view of what happened, and that’s exactly what release 1.9 of Optomo delivers with the new Desktop Agent giving you a lens into your machines as your robots work on them.
Version 1.9: Introducing the Optomo Desktop Agent
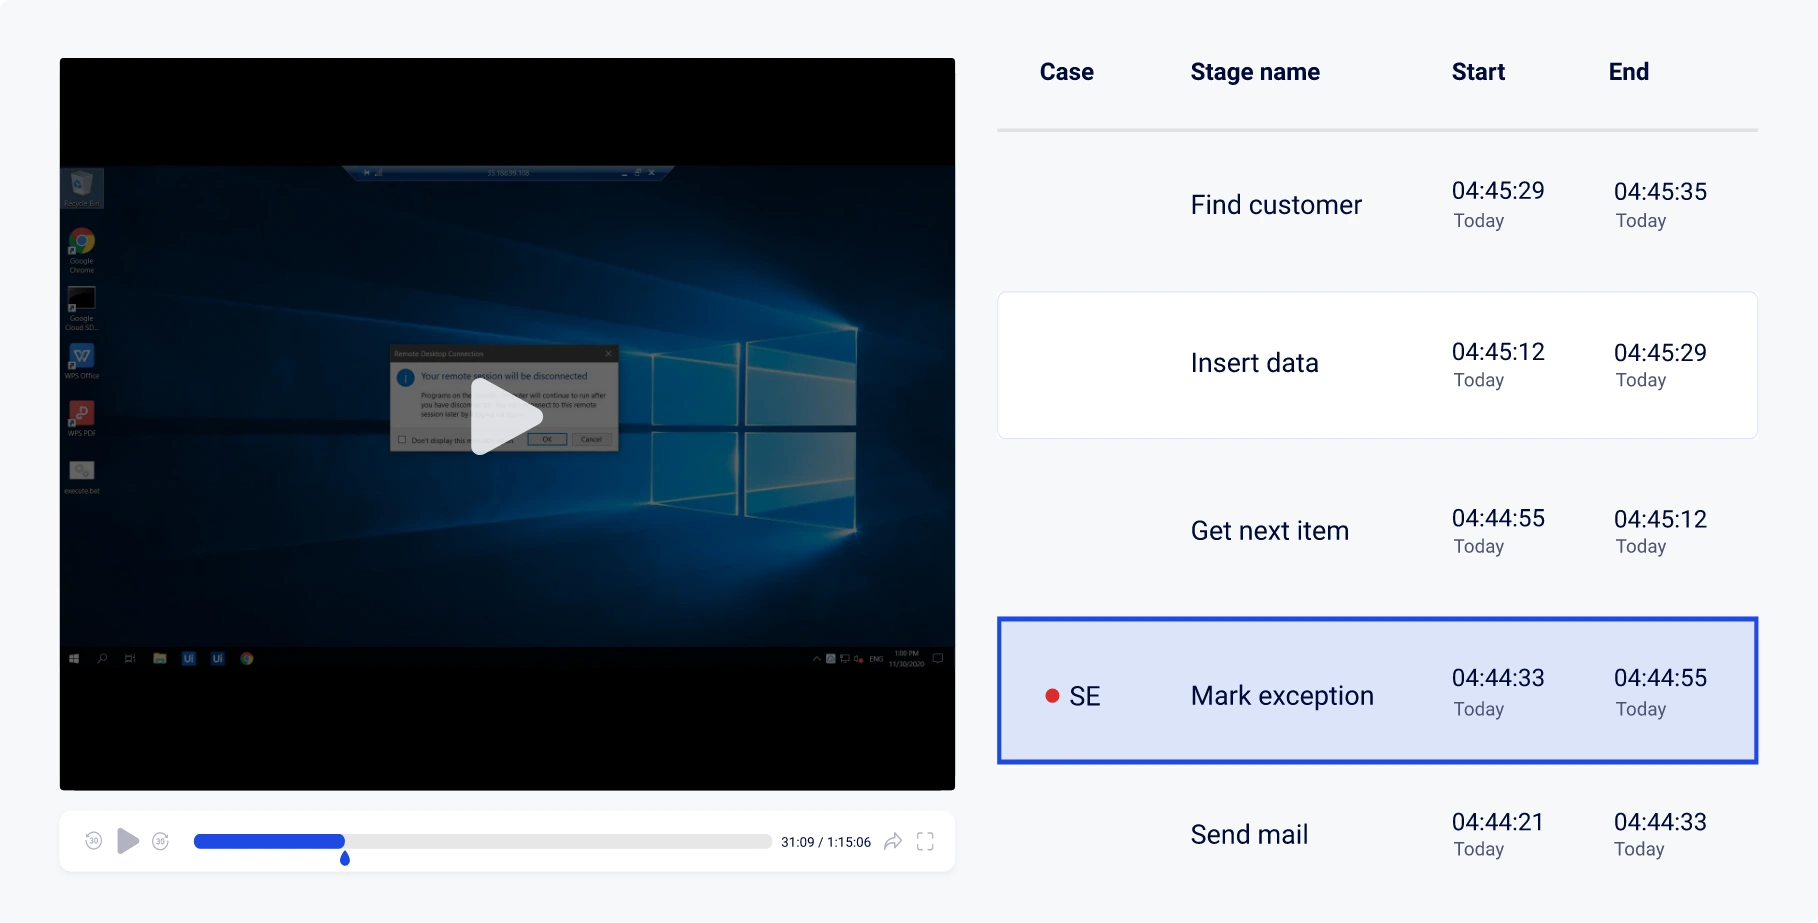
By enabling the Optomo Desktop Agent coming with version 1.9, you can now observe your bots in their local environment as they run – as well as revisit past session to understand exactly how things unfolded. In Optomo, you can access the visual playback directly from your session logs or specific processed cases of your interest. Say you come in to work and see there was an error on one of the cases your bot processed yesterday, in a few clicks you can see exactly what the bot was seeing at the time of the error.
You can move between log entries like bookmarks and instantly jump to the corresponding point in the recording. Case activity is flagged directly in the playback view, making it easy to connect issues back to the work being processed.
This new visibility changes the way teams troubleshoot and monitor automations. Investigations that once required guesswork or repeated test runs can now be addressed by simply navigating to the right moment and watching it play out.
This means less time reproducing bugs, fewer blind spots in your automation landscape, and faster paths to resolution – before small issues become bigger ones.
One early tester in fact reported saving up to 95% of the time spent debugging using the new feature!
Designed for control and security
Access to both streams and recordings are limited to your user roles and the specific RPA tasks you enable the feature for. There are configurable retention policies and video quality settings to prevent storage bloat. An extended event log also keeps track of when recordings are accessed, helping teams maintain accountability and oversight.
By combining logs and case data with visual playback, your team can resolve issues faster, improve auditability, and keep operations running smoothly.
Get in touch today to see how Optomo and the new Desktop Agent can help you.

Ready to redefine your RPA operations? Discover Optomo in action. Schedule your demo today!